
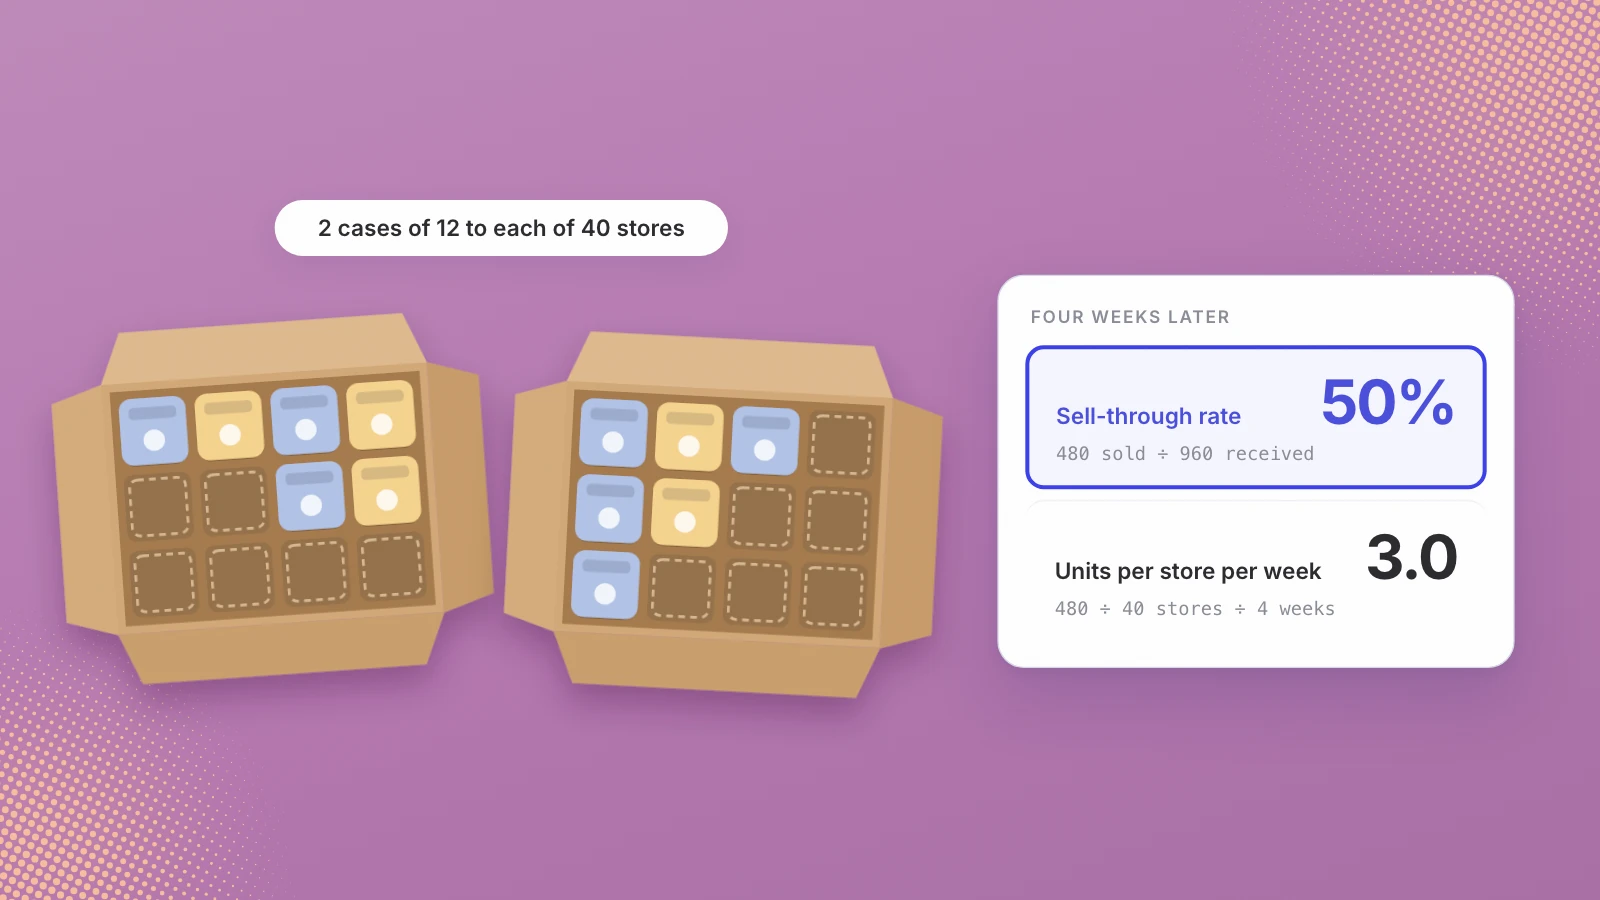
Sell-through rate is units sold divided by units received, times 100, for a stated period: 480 units sold out of 960 received is 50%. Grocery buyers also judge velocity, units or dollars per store per week. SPINS says some retailers set velocity targets for each category, and items that keep missing them risk discontinuation.
Sell-through rate is the share of the stock a store received that it sold to shoppers in a set period. Velocity is how fast an item sells in the stores that carry it, usually counted per store per week. The first tells you whether an order was the right size. The second is what a grocery buyer uses to decide whether your item keeps its place. Both are the last stage of our founder’s guide to getting into retail stores.
Getting on the shelf is a sale. Staying there is a number.
What is the sell-through rate formula?
Sell-through rate = units sold ÷ units received × 100, over a stated period. Inside Supply Management, the Institute for Supply Management’s magazine, gives the standard example: a retailer receives 5,000 units, sells 3,000 in a month, and has a 60% sell-through, with 40% of the stock still on hand.
Two choices change the answer, so state both whenever you quote one: the period, because four weeks and a season are different questions, and the denominator, units received or opening stock plus receipts, which gives a lower rate for the same sales.
Sell-through is clearest for a fixed buy, such as a seasonal item or a first order. For an item that is restocked every week, the measure the data providers report, and buyers rank, is velocity.
What does velocity mean in retail?
Velocity is the rate a product sells over time, adjusted for how widely it is stocked. SPINS boils it down to sales divided by distribution, where distribution can be the number of stores selling, %ACV or total distribution points. Circana says the two common forms are average weekly units per store and average weekly dollars per store. The three formulas a founder needs:
| Metric | Formula | What it answers |
|---|---|---|
| Sell-through rate | Units sold ÷ units received × 100 | Was the order the right size? |
| Units per store per week | Units sold ÷ stores selling ÷ weeks | How many shoppers pick it up in a typical store? |
| Dollars per store per week | Dollar sales ÷ stores selling ÷ weeks | How much money it brings each store |
Which one to lead with? SPINS’ velocity guide says to use whatever measure your buyer uses, and to ask ahead of time. It adds that unit velocity flatters items priced below the subcategory’s average retail price, and dollar velocity flatters items priced above it.
How do you calculate sell-through and velocity for your own item?
Here is one invented item run through every formula, so you can swap in your own numbers. A snack brand ships 2 cases of 12 to each of 40 stores in a regional chain. Four weeks later the chain’s report shows 480 units sold at a $4.99 shelf price.
| Step | Formula | Example |
|---|---|---|
| Units received | Stores × units per store | 40 × 24 = 960 |
| Dollar sales | Units sold × shelf price | 480 × $4.99 = $2,395.20 |
| Sell-through rate | Units sold ÷ units received × 100 | 480 ÷ 960 × 100 = 50% |
| Units per store per week | Units sold ÷ stores ÷ weeks | 480 ÷ 40 ÷ 4 = 3.0 |
| Dollars per store per week | Dollar sales ÷ stores ÷ weeks | $2,395.20 ÷ 40 ÷ 4 = $14.97 |
| Weeks of supply left | Units on hand ÷ units sold per week | (960 − 480) ÷ (480 ÷ 4) = 4.0 weeks |
| A year at 100 stores | $ per store per week × stores × 52 | $14.97 × 100 × 52 = $77,844 |
The last row is the projection SPINS’ sell-story guide uses when a brand pitches for more stores. Now say only 32 of the 40 stores sold a single unit, because 8 left the cases in the back room or never put up the shelf tag. Per store actually selling, velocity is 480 ÷ 32 ÷ 4 = 3.75 units a week, 25% above the chain-wide 3.0. That gap is a stocking problem, not a shopper problem, and it is the first thing to fix.
Why do buyers compare you to the category?
Because a velocity figure means little on its own. Circana says sales rate is relative: it depends on the retailer, the category and the specific items it is compared with. NielsenIQ describes velocity as how quickly a product sells compared with similar products, and says buyers want to be assured a product like yours will sell briskly before they commit to an order. Circana’s guide to reading your rank, item against item:
- Top 25%: a strong position to build a story on.
- Top 50%: solid, but aim to climb.
- Bottom 25%: what Circana calls the danger zone, the items a buyer targets to de-list to make room for better performers.
Expect your average to fall as you grow. SPINS notes that a brand’s first few stores usually sell best when it built local recognition before launch, so new stores pull the average down, and that this is usually not a big deal while total units and dollars keep rising. A buyer at each chain will still rank your item against the ones beside it.
What happens to slow sellers at a line review?
They are the first candidates to go. SPINS says some retailers set velocity targets for each category, and an item that keeps missing the threshold is at risk of discontinuation. Writing on ECRM’s blog in 2019, Cathy Shifflett, who has worked on both the supplier and the retailer side, called items in the bottom 10% to 20% of category sales candidates for deletion whenever a new item is presented, and said she has seen items discontinued six to eight months after reaching the shelf.
The tools are built for this. When Walmart moved suppliers to its Luminate data service in 2023, its memo, as reported by Talk Business & Politics, called it the tool merchants and suppliers use for line reviews, quick modular changes and item swaps. Shifflett’s advice for an item that is failing: propose the replacement yourself, before the buyer does.
Where does sell-through and velocity data come from?
Three places, and it pays to know which one your buyer reads:
- The retailer’s portal. Walmart’s supplier data service, launched as Luminate, was renamed Scintilla, and its basic tier comes at no added cost; Walmart Data Ventures calls it Scintilla Basic. Other chains have their own reports, so ask your buyer which one they use.
- EDI 852 reports and distributor tools. Some retailers and distributors send the 852 product activity document, which SPS Commerce describes as sharing sales and inventory details, down to the store. KeHE gives its suppliers CONNECT BI analytics; our broker and distributor guide covers how distributors work.
- Syndicated data. SPINS covers natural, regional and independent grocery and, with Circana, conventional stores; its guide says retailers report UPC, description, units and price for each item, with new data every 28 days. Circana sells Liquid Data Go to small brands, from $499 per report bundle on its Startup CPG partnership page.
Before your first meeting, ask the buyer which source and which velocity measure they will judge you on. Then track that one, every week.
How do you increase sell-through rate?
Fix supply first, then build demand. These are the levers in SPINS’ velocity guide, which warns that even a missing or wrong price tag can drag velocity down:
- Close the voids. Compare stores carrying with stores scanning each week, as above, and fix stock and shelf tags before anything else.
- Use price and promotion, then read the average. SPINS warns that advertising, sales or demos can skew a single week, so judge them on 12, 24 or 52-week averages.
- Demo where the store allows it. SPINS counts demos among the levers that lift velocity.
- Advertise around your stores. SPINS names advertising targeted around store footprints. Tell followers which stores carry you, and give them a reason to go.
A broker I spoke with this spring told me a lot of creator buzz comes down to luck, and that a viral moment tends to fade within about a week (more from that conversation). So steady local posting matters more than one hit; our 90-day launch plan lays it out week by week.
This is the part Leo for consumer brands works on. Leo turns footage you already own into daily posts, so a store launch or a demo day becomes a run of posts, and on the Pro plan each post can carry click tracking in its first comment. Its creator campaigns look for creators whose followers match your buyers; in FitCommit’s campaign, 22% of creators reached by email said yes, against 4% by Instagram DM. None of this guarantees a better line in a buyer’s report; it gives shoppers near your stores more reasons to look for you.
If your first scan report lands this quarter, plan how you will lift the stores you have before asking for more. See how Leo works for consumer brands.
Distribution gets you a chance. Velocity decides whether you keep it.
Sources
- Institute for Supply Management, The monthly metric: sell-through rate
- SPINS, CPG glossary: velocity
- SPINS, Mastering sales velocity
- SPINS, Sell story fundamentals
- Circana, What is sales rate? A guide for CPG brands
- Circana, Liquid Data Go and Startup CPG
- NielsenIQ, Key terms CPG retail buyers expect you to know now
- ECRM, Getting on the shelf is only the beginning
- Talk Business & Politics, Walmart requiring all suppliers to move to Luminate data service
- Talk Business & Politics, Walmart Data Ventures to rebrand Luminate to Scintilla
- Walmart Data Ventures, Get to know Scintilla
- SPS Commerce, EDI 852: product activity data
- KeHE, Get your brand discovered (suppliers)
Written by Lera Leonteva. Leo AI makes social video and runs creator campaigns for consumer brands, so we have a commercial interest in the marketing part of this guide. Formulas and retail data facts are from data providers, retail trade press and Walmart’s own pages, read November 2026.